Dynamic Vertical Line on a ScatterPlot
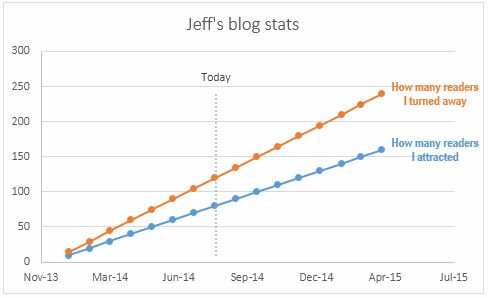
I use XY charts for schedules and I like to have a vertical line showing today’s date. I do this so frequently I have a named range for each of the X and Y values. To get the current date to show up as 2 similar X values the best I could come up with is:
=(ROW(INDIRECT(“1:2″))/ROW(INDIRECT(“1:2″)))*TODAY()
There must be a better way, but I can’t just put ={TODAY(),TODAY()} as a value and I’m curious why.
Until somebody smart like Charles Williams jumps in with a better explanation, the reason you can’t put individual functions into an array is that you can’t. I know, it sucks. I’d like to be able to do that too.
Edit: Colin Legg beat Charles to it:
When you use { } within a formula they are delimiters for an array constant. The formula parser won’t let you embed functions or references within an array constant because, by definition, the elements wouldn’t be constant anymore.
That said, you can get there indirectly:
=TODAY()*{1,1}
={41854,41854}
Sure Jeff, but I want to be able to put different functions in each array position.
Not a problem…with a bit of cleverness, you can do the equivalent of this:
={MIN(SomeRange),Max(SomeRange)}
…like this:
=MIN(SomeRange)*{1,0}+MAX(SomeRange)*{0,1}
…which says to Excel:
- Populate a 2-element array with the minimum of SomeRange, but multilpy the first element by 1 and the second element by 0, in order to clear the minimum from that second element.
- Populate a 2-element array with the maximum of SomeRange, but multilpy the first element by 0 and the second element by 1, in order to clear the maximum from that first element.
- Add them together, leaving just the minimum in the first, and the maximum in the second.
So how does this tie in with what GMF wants to do, i.e. put a vertical line in an XY chart to show the current date?

Well, because this is an XY chart, you only need two coordinates to draw that date line line: the point at the bottom, and the point at the top.
So to get the X values we want – today’s date, we define a name called Today:
=TODAY()*{1,1}
And for the Y values – the Min and Max values across both ‘Values’ series – we define a name called MinMax:
=MIN(SomeRange)*{1,0}+MAX(SomeRange)*{0,1}
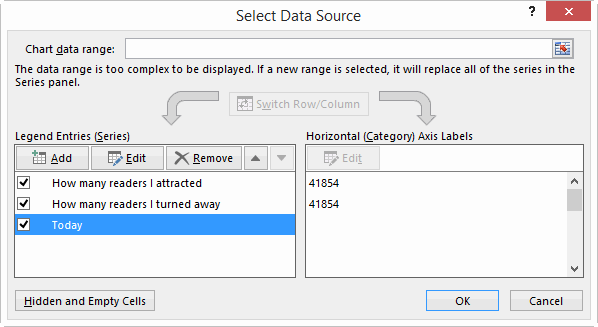
And then we can add a new series called Today to our chart:

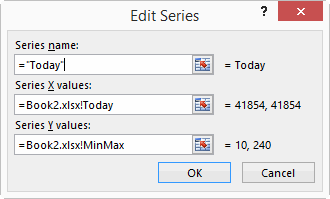
…with the X and Y coordinates of that series pointing at the appropriate name:

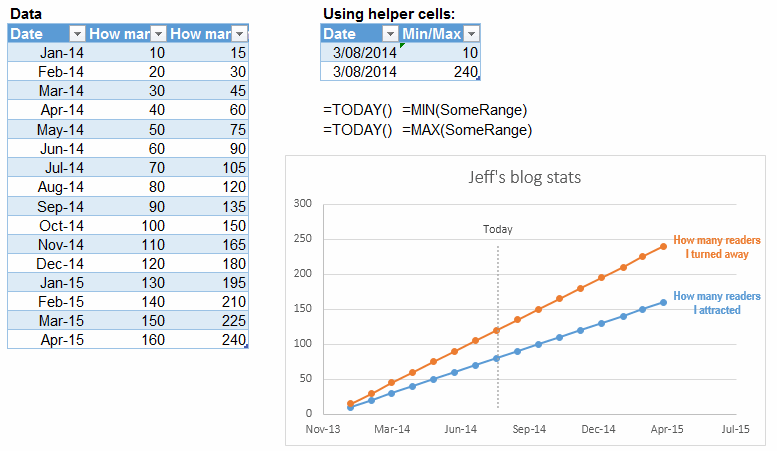
Of course, you don’t actually need a Named Range to do this… you can simply have some helper cells in the actual worksheet that calculate the Min and Max values of the entire block of data, and point your Today series at that:

Here’s a sample file with both approaches: Todays Date on ScatterPlot
Maybe this stuff is all included in Dick and Mike’s book 101 Ready-To-Use Excel Formulas. I don’t know…I’m still waiting for my free advance copy in the post.
Well, that’s all folks. Hopefully this post moved those lines on the chart closer together rather than pushing them apart.


