


Chart LeaderLines in Excel 2010 or earlier.
I love the Leader Lines that Excel 2013 puts in for you if you’re using Excel 2013 and you drag a datalabel somewhere. If you want to use Leader Lines in earlier versions, then they are only available if you use a pie chart. And we all know what Peltier would say about that, don’t we.
So I thought I’d have a crack at programatically adding leader lines to ‘Peltier-approved’ chart types via VBA shapes.
First, let’s look at what those native leader lines in Excel 2013 look like, eh?
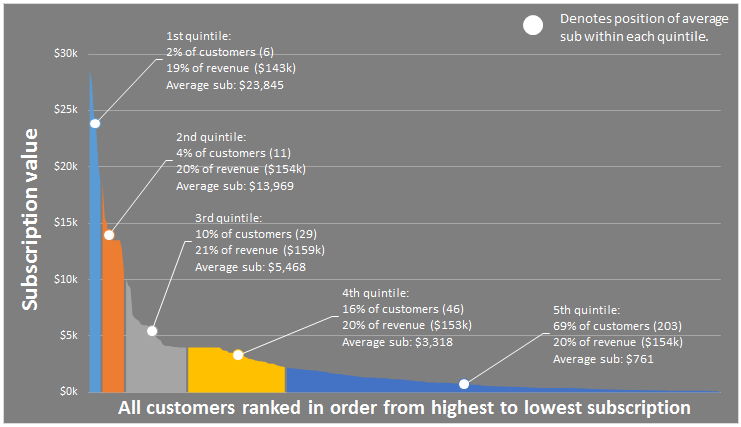
Ha! Fooled you…those are my programaticaly applied lines in Excel 2010.
I added these via using a Freeform shape, and the code lives inside a Class Module, so that if you move a data label around, the leader line gets redrawn. For instance, let’s drag that 4th data label North-East:
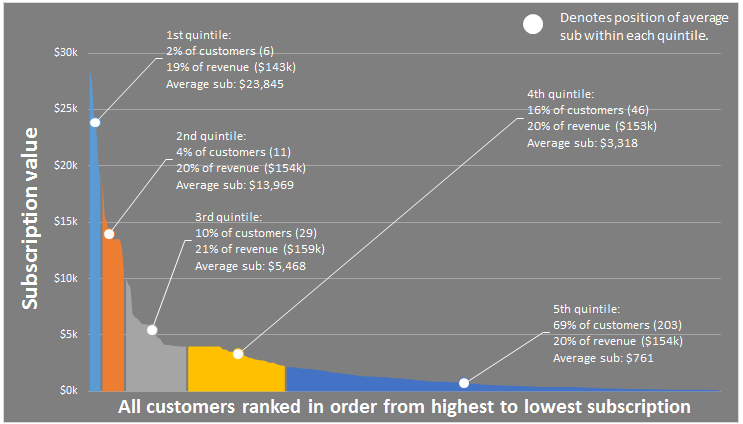
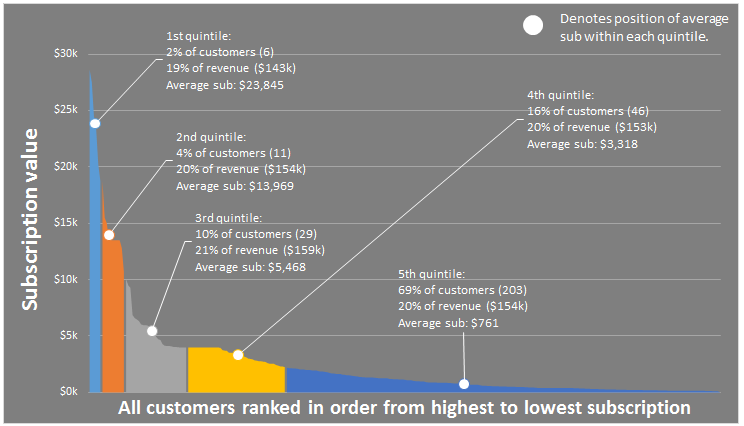
Just like in Excel 2013, my routine intelligently connects the leader line to the appropriate side of the data label, depending on it’s position relative to the point it connects to. For instance, let’s park that 5th data label directly over the point it refers to:
…and now let’s put it on the left:
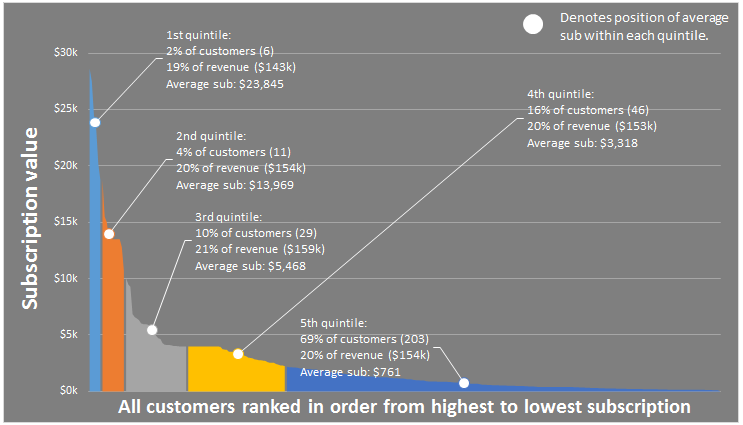
And if the data label obscures the point, no leader line is produced:
I used a Class Module to do this. In fact, this is the first Class Module I have ever written:
Public WithEvents clsChart As Chart
Private Sub clsChart_Mouseup(ByVal Button As Long, ByVal Shift As Long, ByVal x As Long, ByVal y As Long)
Dim IDNum As Long
Dim a As Long
Dim b As Long
Dim shpLeaderLine As FreeformBuilder
Dim pt As Point
Dim lKink As Long
lKink = 5
Dim bLabel As Boolean
Dim shp As Shape
ActiveChart.GetChartElement x, y, IDNum, a, b
If IDNum = xlDataLabel Then
On Error Resume Next
ActiveChart.Shapes("LeaderLine_" & a & "_" & b).Delete
On Error GoTo 0
bLabel = True
Set pt = ActiveChart.SeriesCollection(a).Points(b)
Set shpLeaderLine = ActiveChart.Shapes.BuildFreeform(msoEditingAuto, pt.Left, pt.Top)
With shpLeaderLine
Select Case pt.Left
Case Is < pt.DataLabel.Left
.AddNodes msoSegmentLine, msoEditingAuto, pt.DataLabel.Left – lKink, pt.DataLabel.Top + pt.DataLabel.Height / 2
.AddNodes msoSegmentLine, msoEditingAuto, pt.DataLabel.Left, pt.DataLabel.Top + pt.DataLabel.Height / 2
Case Is > pt.DataLabel.Left + pt.DataLabel.Width
.AddNodes msoSegmentLine, msoEditingAuto, pt.DataLabel.Left + pt.DataLabel.Width + lKink, pt.DataLabel.Top + pt.DataLabel.Height / 2
.AddNodes msoSegmentLine, msoEditingAuto, pt.DataLabel.Left + pt.DataLabel.Width, pt.DataLabel.Top + pt.DataLabel.Height / 2
Case Else
Select Case pt.Top
Case Is < pt.DataLabel.Top
.AddNodes msoSegmentLine, msoEditingAuto, pt.DataLabel.Left + pt.DataLabel.Width / 2, pt.DataLabel.Top
Case Is > pt.DataLabel.Top + pt.DataLabel.Height
.AddNodes msoSegmentLine, msoEditingAuto, pt.DataLabel.Left + pt.DataLabel.Width / 2, pt.DataLabel.Top + pt.DataLabel.Height
Case Else
bLabel = False
End Select
End Select
If bLabel Then
Set shp = .ConvertToShape
With shp
.Name = "LeaderLine_" & a & "_" & b
.Line.ForeColor.ObjectThemeColor = msoThemeColorBackground1
End With
End If
End With
End If
End Sub
I use the Workbook_Open event to trigger this:
Dim myChart As New clsChart
Private Sub Workbook_Open()
If Application.Version < 15 Then
Set myChart.clsChart = Sheet1.ChartObjects("Chart 1").Chart
End If
End Sub
I can’t say I fully understand Class Objects yet. For instance, I’d like to amend this code so that it works on multiple charts. I know the answer to this will be buried within Chip Pearson’s exhaustive but dense page at http://www.cpearson.com/excel/classes.aspx …but I’m too dense to absorb all this. I was kinda hoping you’d find it for me ![]()
I also note that the code doesn’t always trigger for some reason, when moving the data label. I suspect it’s because I’m still moving the mouse at the time that I release the click button, as this only seems to happen when I’m moving the data label from left to right. Anyone got any pointers on this?
Here’s the file: